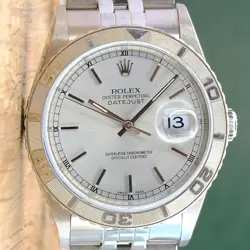
GOLD TURN-O-GRAPH - Rolex Watches : Pricing & Market Analysis
Market Analysis Dashboard
Comprehensive data visualization for GOLD TURN-O-GRAPH market trends, sales performance, and pricing insights.
Listing Status
Item Condition
Market Overview
Recent Sales Analysis
Pricing Overview Comparison
Top Sellers
Top Countries
| Country | Listings | Percentage |
|---|---|---|
 US US |
2 | 100.00% |
Global Distribution
Regional Analysis
Price by Country
Price by Condition
Price Range Analysis
Price Outliers
Price Comparison by Listing Status
Status Distribution
Success Rate by Condition
Status Metrics
| Status | Count | Percentage | Avg. Price | Min-Max Price |
|---|---|---|---|---|
| Active | 0 | 0% | $6,427.00 | $6,427.00 - $6,427.00 |
| Sold | 1 | 50% | $5,799.99 | $5,799.99 - $5,799.99 |
| Unsold | 1 | 50% | $6,427.00 | $6,427.00 - $6,427.00 |
Status by Condition
Price Comparison by Status
Top Sellers Distribution
Seller Metrics
Geographic Distribution
Top Sellers
Top Active vs. Top Sold Sellers
Market Summary: gold turn-o-graph
A comprehensive overview of market trends and sales performance for this item.
Market Size & Volume
The data encompasses a comprehensive set of 2 listings representing 1 national markets, with a market price spectrum of $5799.99-$6427.00. The typical price hovers around $6113.50 (mean) or $6113.50 (median).
Sales Performance
Available inventory includes 0 active entries in the marketplace. Historical data reveals exactly 1 completed transactions, yielding a 50% sell-through rate. The average sold price is $5799.99, which is 9.8% lower than the average asking price for active listings.
Market Composition
The market includes 2 individual sellers with an average of 1.0 listings per seller. By condition, the market consists of 100.00% new items, 0.00% used items, and 0.00% refurbished items.
Geographic Distribution
The market for gold turn-o-graph has a global footprint with listings from 1 countries. The top country by volume is US (100.00%).
Price Analysis
The price distribution shows a standard deviation of $313.51, indicating a relatively stable market. The coefficient of variation is 5.1%. The median-to-mean ratio of 100.0% suggests the distribution is fairly symmetric with some low-priced outliers affecting the average.
Market Value Assessment
The total market value for gold turn-o-graph is estimated at $12,226.99. Successful sales account for $5,799.99 of this value. Based on pricing trends and sell-through rates, this appears to be a competitive market with consistent pricing.
Related Listings
Browse the latest items related to GOLD TURN-O-GRAPH that have appeared in the marketplace.
Similar Tags
Discover related tags with market characteristics and potential buyer interest matching the current tag.

